SETTINGS
Appearance
Language
About

Settings

Select a category to the left.

Appearance

Theme

Light or dark? Choose how the site looks to you by clicking an image below.

Light Dark

Language

Preferred Language

All content on utk.claranguyen.me is originally in UK English. However, if content exists in your preferred language, it will display as that instead. Feel free to choose that below. This will require a page refresh to take effect.

About

"utk.claranguyen.me" details

Domain Name: claranguyen.me
Site Version: 3.0.1
Last Updated: 2019/08/18
Metadata
Talk #4 - gextract: Graph Construction from Images
Description: A way to use Disjoint-Sets to generate graphs from photos and then apply path-finding algorithms on them between two specified points.
Slogan: Let's just generate everything...
Presenters: Clara Nguyễn
Type: Class Presentation
Date Originally Presented: 2019/12/03
Downloads: [ Slides ] [ GitHub Repo ]
Talk Summary
Disjoint-Sets can be applied to binarised images to pick out certain connected objects. When combining this with morphology, we can take images with specific points, try to construct graphs with objects found, and then perform Depth-First Search from any set to any other set.

This is a very swift talk, being only 3 minutes long. However, there isn't much to be discussed. In the end, you should be able to take a (somewhat specific) image, generate a graph with it, and perform DFS on it from (x1, y1) to (x2, y2).

Since the audience is students in Dr. Jens Gregor's ECE 472/572 (Digital Image Processing), I will assume they know Disjoint-Sets, as it was covered already. For Depth-First Search, I have written a guide that sums this up... as well as a document discussing a general algorithm for it.
Stages of processing
Normally, in a University Computer Science program, a graph is given via explicit data that a student is tasked with parsing to an algorithm on. With this plugin, we wouldn't be using text or integer data to define a graph... but an actual image itself. To get data, we must use some combination of a few filters to manipulate the image to get what we want:
  • Morphology - On a binarised image, we can use "Opening" to remove lines from an image, which would leave only the objects we need for Disjoint-Set computing.

  • Connected Components - Post-morphology, we can use Disjoint-Sets to figure out what objects are in the image. We are also able to get what set each object is at a per-pixel level (which serves as a "from" and "to" for a DFS run).

  • Line Detection - We need line detection to take place for the program to figure out whether a set can go to another or not. It wouldn't be a graph if we didn't have anything to traverse to. There's a multitude of ways to do this. We can run a morphological command to attempt to remove the nodes, then use Disjoint-Sets on the remaining pixels. Or, we can use an actual line-detection algorithm.
Stage 1: Figure out the Nodes
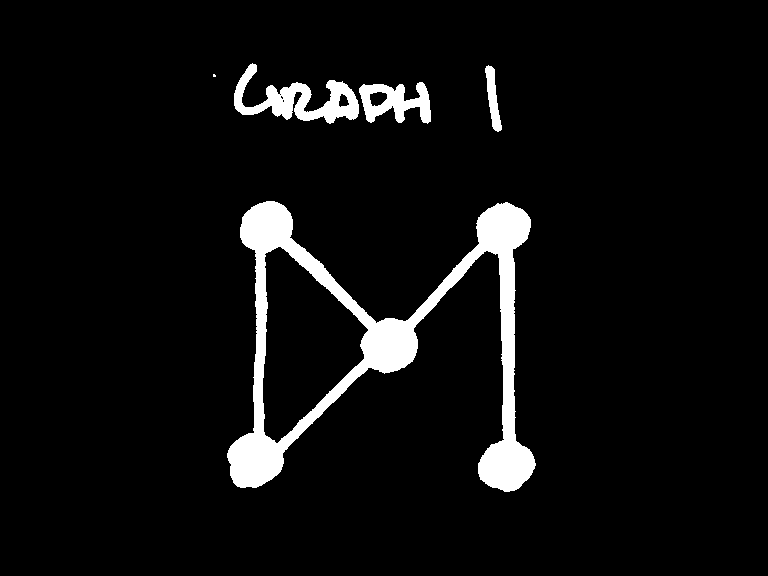
Assume the following image is what will be run through the plugin:


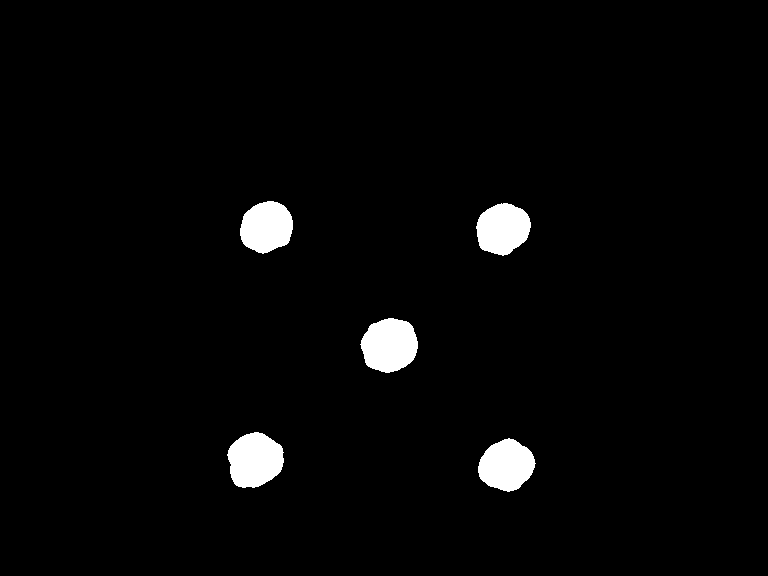
Pretty simple graph huh (and it looks pretty similar to the icon for this presentation)? Extracting the nodes here is fairly trivial with morphology. Let's use "Opening" (an erosion, followed by a dilation) with a high enough radius that it'll remove the edges, but not the nodes. We must also binarise the image to force pixels to be either entirely white or entirely black. With a radius of 10, we are able to extract the nodes:


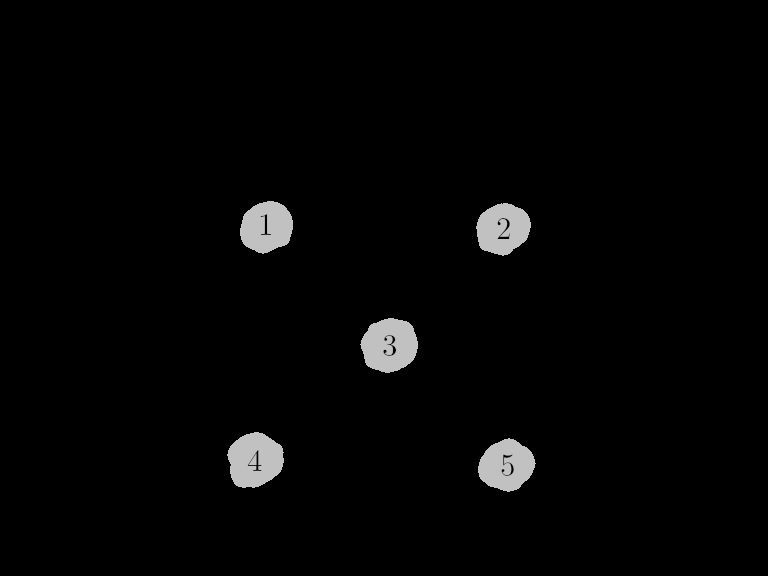
Awesome. Now we can use Connected Components (Disjoint-Sets) to figure out where these objects are in the image, and store them. Just so it's easier to know what's what, let's number these nodes with what the Connected Components plugin does... 1 through 5 (Set 0 is the outer background):


Stage 2: Figure out the Edges
So now we have the nodes. That's nice but now we need the edges. Grabbing those actually takes no special plugin at all. Simply take the binarised version of the image, invert it, and then get the differences between that and the image with only the nodes. For reference, here's the inverse binarised version of the original image:


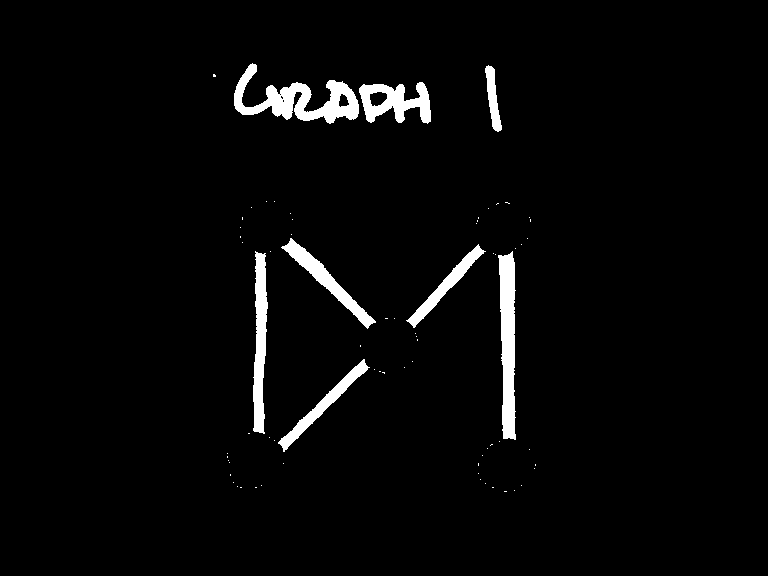
When we find differences between this image and the one with only the nodes, we get this rather elegant result:


Despite the text at the top... this is exactly what we want. We have the edges of the graph. Now's the part where we have to use our fancy plugins. Chuck this image into the Connected Components plugin and set the minimum size to be high enough to where the pixels outlining the original nodes are gone. You'll be left with some fragments of the text, as well as the edges as separate objects.
Stage 3: Graph Connectivity
It isn't a graph if it doesn't have nodes and edges. We have our nodes and edges as separate images. This information isn't really enough though to tell what's connected, as there is no point where an (x, y) value is white in both images. To counter this, we have to cheat a little bit.

A valid approach would be to use the Morphology plugin's Dilate option to expand the edges, then check if it collides with any nodes. But we have to be very careful, as the dilation may result in 2 edges joining together.

The solution? Make a temporary image for each edge detected by the Connected Components plugin. I'm not going to paste like 5 images here, but we're going to have 1 image per set that was found with that plugin. This way, we can dilate any of them as much as we wish and there won't be any overlap. Perfect!

Here's one edge that was detected, put in its own image, and then dilated:



Now then, we can build the graph. Scan through every white pixel and use the Connected Component's "find" function to check if we have collided with a node. If so, add it to a list. After scanning all pixels, if the list size is 2 (if the edge only met with 2 nodes), then the 2 nodes that the edge collided with are connected.

You are going to repeat this for every edge image. Discard the ones where it collides with either more or less than 2 nodes, as they are invalid. In the end, you will have your graph generated. I had mine output debug data to make sure that they are connected, and it gave me this:
Graph Output
[1 -> 3]
[2 -> 3]
[1 -> 4]
[2 -> 5]
[3 -> 4]
It's counting nodes from left-to-right, top-to-bottom by the very nature of the Connected Components plugin. Let's number the ones in the image and see if they line up...
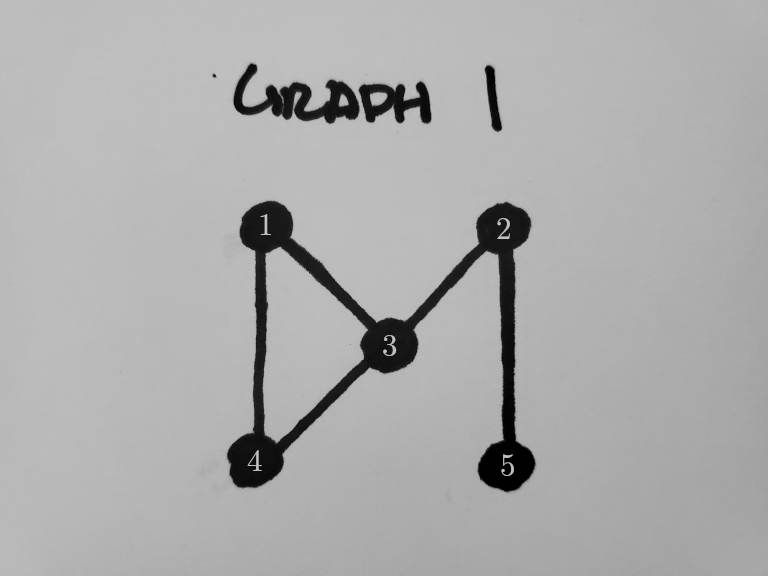


Those 5 edges definitely match up! We have successfully generated a graph straight from an image.

Now that we have nodes and their edges constructed, we can easily run DFS on the graph to go from one node to another. The best part is that we can specify the "to" and "from" points with pixels because the Connected Components "find" function will give the index of the node at a current pixel.
Web App: gextract_view
What good are tools like graphgen and graphpak if we can't put them to good use? Because apparently JavaScript is (unfortunately) the future, I have written a mini web application here that can read gpak files, display them, and let you interact with them, being able to select 2 points to find a path between. Give it a shot! Feel free to generate your own gpak files as well.

gextract_view: http://utk.claranguyen.me/talks/gextract/app.php

The other links are at the top of this talk page. It's all open source.