SETTINGS
Appearance
Language
About

Settings

Select a category to the left.

Appearance

Theme

Light or dark? Choose how the site looks to you by clicking an image below.

Light Dark

Language

Preferred Language

All content on utk.claranguyen.me is originally in UK English. However, if content exists in your preferred language, it will display as that instead. Feel free to choose that below. This will require a page refresh to take effect.

About

"utk.claranguyen.me" details

Domain Name: claranguyen.me
Site Version: 3.0.1
Last Updated: 2019/08/18
Introduction
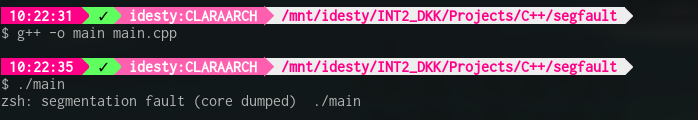
When you are programming in languages like C/C++, chances are that you get errors such as segmentation faults. You know these errors well, probably. And you probably have come to hate them a lot. However, as crazy as it sounds, you want segmentation faults when your program messes up. Yeah I said it, segmentation faults are your friends. And I say that because they are errors that you can debug a lot more easily than ones that don't crash your program.

Now why do I mention all of this? 
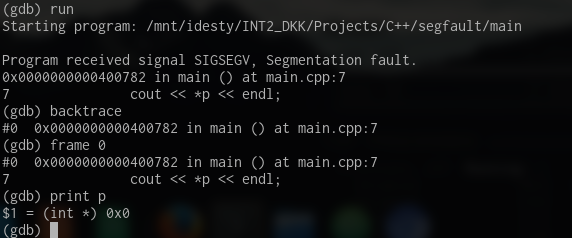
There are tools out there that can, when your program segfaults, tell you exactly where the issue is in your code. I'll introduce you to a fan-favourite, GDB. GDB can, when used correctly, be used when your program segfaults to find out what variable, function, pointer, etc causes the crash.
An example
I like to just jump straight into an example. So, let's write a bad program... Just because we can.
Code (C++)
#include <iostream>

using namespace std;

int main() {
    int* p;
    cout << *p << endl;
}
So when we run the code, as expected, we have a segmentation fault. Behold.


So just for those who do not know what a segmentation fault (or "segfault", for short) is, it is when the program tries to access memory that it does not have permission to access. Segmentation faults are also caused when you try to access memory that is out of bounds either by software or hardware means.

So what do we do? Well it is obvious that the variable "p" is undeclared and we are trying to print an int at the undefined address, but let's pretend that we don't know that. Let's do it with GDB...


Look at that! It told us that the line which consisted of printing out "p"'s dereferenced value is where the program crashes.

"Stop right there Clara! What does all of this mean and how do I do this?"

Right...
How to actually use GDB
Let's take it from step 1.

If you are using gcc/g++ to compile your program, add the "-g" flag in while you compile your program. This will prevent the compiler from changing function or variable names for optimisation.
UNIX Command
g++ -g -o main main.cpp
Okay, so now you have compiled your executable with debugging symbols loaded. Great. Now you may want to test your program with the ordinary approach of ./main... but let's not do that. This time, try this (AND DO NOT PUT ARGUMENTS OR PIPES IN IT).
UNIX Command
gdb ./main
This will start up GDB and tell it "We are wanting to run main in our debugger". GDB is a command interface on its own too. It has its own commands. I'll put a list/cheatsheet below, but for now, let's run GDB. The run command will run the executable.
GDB Command
run
NOTE: If you wanted to run the program with a pipe or arguments, you can do it via run as well...
GDB Command
run arg1 arg2 < file_in > file_out
Now, assuming your code just failed, it will tell you the issue and where it is in your code. Hence the screenshot:


This screenshot also has 3 more commands featured... backtrace, frame, and print. With these, you can navigate the program's stack frame, to go to a particular function and get variable values, etc. In the screenshot above, everything is happening only in main(), so it's the only function in the stack trace. So if we call this:
GDB Command
backtrace
frame 0
We will go to frame 0 in the code, which is your main() function. Then, since p is a variable in that function's scope, we can grab the value of it.
GDB Command
print p
It prints out (int *) 0x0, which is basically an invalid pointer. The variable is declared, but not initialised, so there's the problem in our code.

So Ctrl+C doesn't kill it. How do I quit gdb?

GDB Command
quit
Command Cheatsheet
There isn't many commands on here but I included a few that you'll actually need. Obviously I wrote this guide as a means to where you can just look up exactly what you need in seconds and then get back to coding.

Command Description Usage(s) Example
run Runs executable file specified in arguments of gdb run
run arg1 arg2 < file_in > file_out
run
run "file.txt" > "out.txt"
backtrace Prints out the stack trace. You can see what functions led up to calling the one that crashed your program. backtrace backtrace
frame After calling backtrace, you can go to a specific frame (defined by the number to the left) and gather information from that frame. frame num frame 1
print Print out a variable in the stack frame. This is actually very versatile, as you can use C/C++ code in it too. print var print p
print *(double*)p
info registers Prints out the values currently stored in all registers on your CPU architecture. info registers info registers
list Shows where, in your code, your program is at when it crashed (and the 10 lines around it). list list
quit Does exactly what the command is named for... quits gdb. quit quit
Guide Information
Basic Information
Name: Introduction to GDB
Description: Because debugging is hard
ID: gdb_intro
File Information
File Size: 7.64 KB (7822 bytes)
Last Modified: 2019/06/13 03:20:52
Version: 1.0.0
Translators
en-gb Clara Nguyen (iDestyKK)